
The Top 10 Performance Metrics for Customer Service (Updated for 2025!)
Discover the 10 most important customer service metrics every business should track in 2025. This guide explains what to measure, how to calculate it, and why it matters—complete with real examples, benchmarks, and optimization tips. Whether you’re improving CSAT, lowering resolution time, or tracking agent performance, this article helps you turn support data into business growth.
Customer service used to be about the charm of a voice, the firmness of a handshake. It’s about numbers: response times, resolution rates, and satisfaction scores.
Behind every cheerful “How can I help you?” is a dashboard lighting up with metrics that can make or break a business. In 2025, with higher customer expectations and smarter tools, knowing what to measure and why isn’t just helpful. It’s essential.
What Are Performance Metrics for Customer Service?
Customer service metrics are quantifiable measurements that show whether your support operations are actually working as they should.
You can think of customer service metrics as your team's GPS. Without the right data feeding the correct next turn (or even a final destination,) you could be speeding in the completely wrong direction.
These aren't just numbers on a dashboard you check now and then. Customer service metrics put data to vague feelings like "we're doing okay." Instead, you can pinpoint a data stream and identify why your first contact resolution rate improved 12% this quarter. They show you exactly where your customer service team excels and where they struggle.
Why does measuring customer service matter so much in 2025? Because customer expectations have getting tighter and more focused. Consumers don't compare you to your competitors anymore - they compare you to the best service they've ever received - anywhere.
Meeting these expectations requires precision, not guesswork. So the most successful customer service operations track metrics across four critical areas:
- Customer sentiment metrics - How do customers feel about their experience? This includes customer satisfaction score (CSAT), Net Promoter Score (NPS), and Customer Effort Score (CES)
- Efficiency metrics - How quickly and effectively does your team work? Track average resolution time, first contact resolution rate, and response times
- Volume metrics - What's your team's workload? This looks like monitoring total number of tickets, peak times, and channel distribution
- Business impact metrics - How does service quality affect your bottom line? Measure customer retention rate, customer lifetime value, and revenue per customer
Customer service metrics act as your GPS. When tracked across sentiment, efficiency, volume, and business impact, they offer a clear view of what’s working, and what needs fixing. Specific indicators can predict customer loyalty and business growth together.
Why Enhance Customer Service Performance with Metrics? Can't We Just Track Total Number of Tickets?
Ticket volume alone won’t guide improvements. Actionable metrics help you detect issues early, replicate what works, and shift from reactive to proactive support.
Your customer support teams live and breathe by measurements that help them do their jobs better. Poor service (even when it's accidental) doesn't just lose you one customer - it can damage your reputation across social media in minutes.
On the other side of the coin, a single moment of exceptional service can turn a customer into a brand advocate who drives new business for you through referrals and positive reviews.
These key customer service metrics serve as your early warning system. They help you spot problems before customers start complaining en masse. Even better, they can reveal which customer service agents have techniques worth replicating across your team.
Without these metrics, you're essentially playing pin the tail on the donkey with your service strategy. With them, you have a clear roadmap for turning frustrated customers into loyal customers who boost your business success.
The Top 10 Performance Metrics for Customer Service You Need To Start Tracking
These ten customer service KPIs cover every critical angle—from satisfaction and resolution speed to agent performance and business impact. Together, they form a blueprint for service success.
1. Customer Satisfaction Score (CSAT)
Your customer satisfaction score is probably the most straightforward metric you can track. CSAT metrics give you immediate feedback on whether you're meeting expectations.
The beauty of CSAT is its simplicity. Send a quick survey after each interaction, and you'll know exactly how satisfied customers feel about that specific touchpoint. A score of 4+ (on a 5-point scale) or 8+ (on a 10-point scale) typically indicates success.
How to Calculate Customer Satisfaction Score (CSAT)?
Naturally, not all customers are the same, which is why you need to have a method for consistent CSAT surveying for your customers. Adding a quick survey into a click to call widget or at the end of a support call is a great time to capture this data.
But here's what matters most: CSAT directly predicts customer retention. This means you can track CSAT by channel, agent, and issue type to begin seeing patterns as they emerge. If email support consistently scores lower than phone support, you know where to focus improvements.

2. Net Promoter Score (NPS)
While the CSAT focuses on the customer's experience, the Net Promoter Score (NPS) answers the question: "Would your customers recommend you to others?"
On a 0-10 scale, customers fall into three categories:
- Promoters (9-10)
- Passives (7-8)
- Detractors (0-6).
How to Calculate Net Promoter Score (NPS)?
You can calculate your NPS by subtracting the percentage of Detractors from Promoters.
NPS = % of promoters – % of detractors
Example:
- Promoters (9–10): 60%
- Passives (7–8): 25%
- Detractors (0–6): 15%
- NPS = 60% − 15% = 45
A score above 50 is excellent, and above 70 is world-class. But the real value isn't the number - it's understanding why customers would or wouldn't recommend you.
When word-of-mouth drives so many purchasing decisions, you'll want to focus on converting Passives to Promoters. They're already satisfied - they just need that extra push to become advocates!
Check also: What Net Promoter Score is Considered Good?
3. Customer Effort Score (CES)
Customer Effort Score (CES) takes the experience questions and creatively turns them. Rather than ask how satisfied they were, CES surveys ask customers how hard or easy it was to solve their problems.
Sure, customers want excellent service. But most also just want their needs or questions answered honestly and fast.
Research shows that customer effort is the strongest predictor of customer loyalty. High-effort experiences drive 96% of customers to become disloyal, compared to just 9% for low-effort experiences (Reasearch by Gartner). That's why reducing friction matters more than adding bells and whistles.
How to Calculate CES?
CES = Total CES score ÷ Number of respondents
Customers respond on a 1–7 scale (1 = very difficult, 7 = very easy).
Example: Total score = 560 from 100 responses → CES = 560 ÷ 100 = 5.6
Mostly CES is measured on a 1-7 scale, where 1 is "very difficult" and 7 is "very easy." Anything below 5 signals trouble. Some of the most common high-effort CES culprits include multiple transfers, repeating information, and channel-switching.
4. First Contact Resolution (FCR)
First Contact Resolution (FCR) measures the percentage of customer issues solved in a single interaction. This means there were no callbacks or follow-ups (and most importantly, no frustration.)
High FCR means less time wasted and faster solutions - a big win for customers. For your customer service team, it means fewer repeat contacts and lower workload. For your business, it means reduced costs and higher satisfaction.
How to Calculate First Contact Resolution (FCR)?
FCR = (Number of issues resolved on first contact ÷ Total number of issues) × 100
Example: If 650 out of 1,000 tickets were resolved in the first interaction: FCR = (650/1000) × 100 = 65%
Industry leaders achieve FCR rates of 70-75%, but the average hovers around 65%. To improve your first contact resolution rate, equip your agents with better training and give them the authority to solve problems without endless approvals.
Tip: You can also incorporate AI-enabled voice agents that are built to solve the most common issues with a near-human touch. In industries where speed and convenience are crucial—for example, in e-commerce—these agents can respond in as little as 3 seconds, helping you resolve problems faster and keep satisfaction high.
5. Average Resolution Time (ART)
How long does it take to actually solve a customer's problems? Your average resolution time tracks the length of time between the moment they reach out until their issue is completely resolved. This includes all the back-and-forth, waiting time, and actual work time.
Don't confuse this with "handle time" (how long you're actively talking). Resolution time includes the entire support process. But remember, faster isn't always better. Rush through complex issues and you'll create more problems.
How to Calculate Average Resolution Time (ART)?
ART = Total time to resolve all issues ÷ Number of resolved issues
Example: If it took 2,000 minutes to solve 400 tickets: ART = 2000 ÷ 400 = 5 minutes per ticket
Track ART by issue type to spot inefficiencies. If password resets take 4 hours but should take 5 minutes, you've found low-hanging fruit. Consider automated solutions or self-service options for these quick wins.
Plus, your customer support team will thank you for removing all of these repetitive customer service tasks from their plate.
6. Ticket Volume
Many companies already track the total number of tickets their team handles. But did you know that this number can reveal more than just workload? It shows the quality of your customer service through qualitative data.
How to Calculate Ticket Volume?
Simple count of support tickets over a set time period (daily, weekly, etc.)
Tip: Break down by type, time, and channel to find patterns.
Rising ticket volumes might mean business growth, but they could also signal product issues or confusing processes. Break down ticket volume by category, time, and channel.
Notice 40% of tickets are "how-to" customer queries? Then it may be time for you to invest in better documentation. Do you see customer service spikes every Monday morning? Then it's time to staff accordingly. The who, what, when, where, and why of ticket volume can tell you a ton about your customer service health.
Smart teams use ticket data to prevent future issues. If 100 customers ask the same question weekly, fix the root cause instead of answering it 100 times.
7. Customer Retention Rate
Your customer retention rate is your business's best report card for service quality. CRR measures what percentage of customers stick around over a specific period.
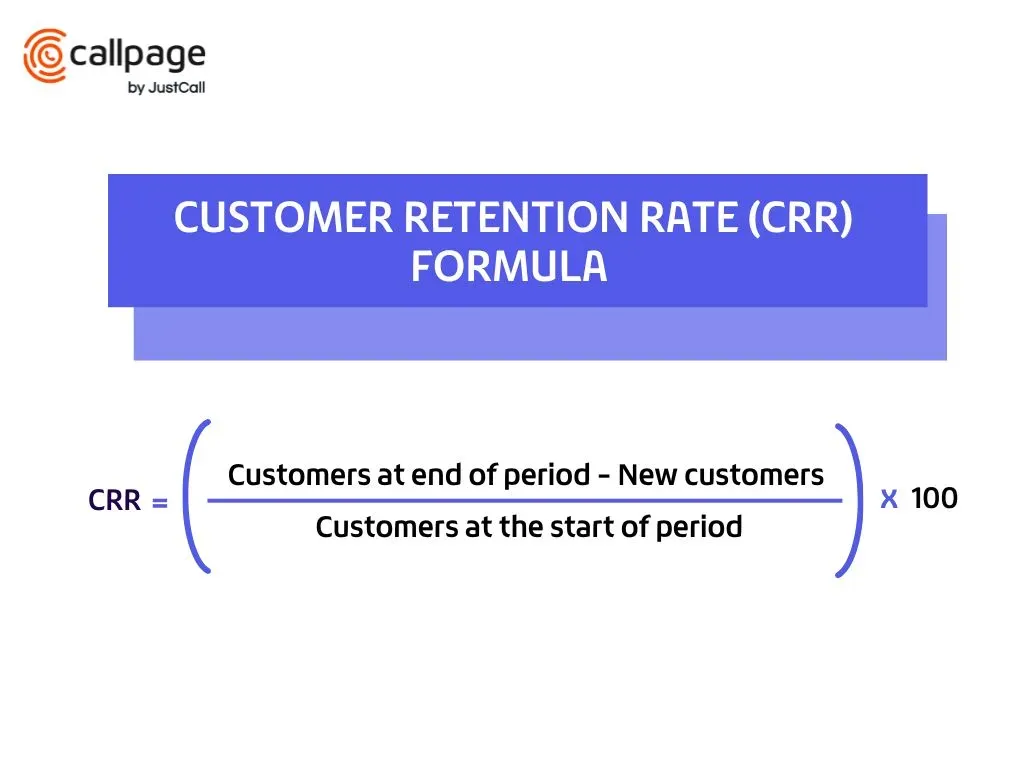
How to Calculate Customer Retention Rate?
Customer Retention Rate =[(Customers at end of period − New customers) ÷ Customers at start of period] × 100
Example:
Start = 1,000, End = 1,100, New = 200
CRR = [(1100 − 200) ÷ 1000] × 100 = 90%
Why obsess over retention? Because, as Harvard Business Review points out, keeping an existing customer can cost anywhere from 5 to 25 times less than acquiring a new one. Calculate retention by dividing customers at period end (minus new acquisitions) by customers at period start. The higher the number, the better you're doing.
Poor service experiences cause customer churn. But when you can enhance customer service performance, you can watch retention soar. Track retention by customer segment to identify which groups need extra attention.
8. Response Time (First Response Time - FRT)
Response time measures how quickly customers get their first human response, not just an expected auto-reply saying "we got your email." It's an instant gratification market, so if customers feel ignored, they'll jump ship quickly.
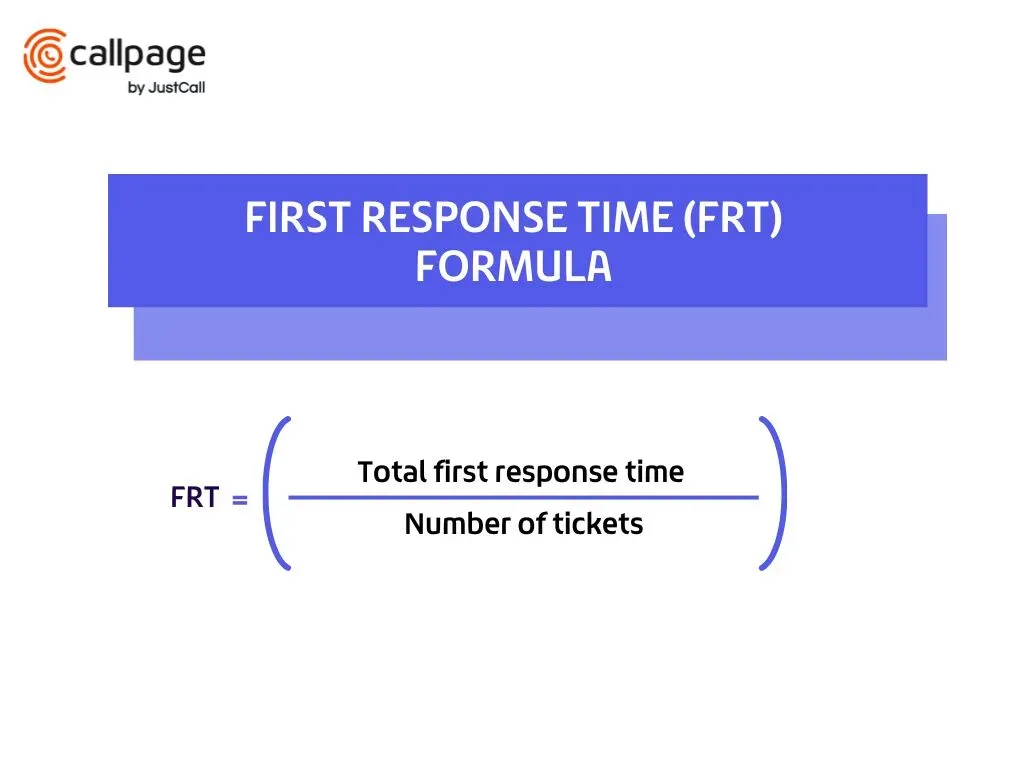
How to Calculate Response Time (First Response Time - FRT)?
First Response Time - FRT = Total first response time ÷ Number of tickets
Example: Total response time = 1,500 minutes for 500 tickets → FRT = 1500 ÷ 500 = 3 minutes
First response time particularly matters because it sets the tone. Respond quickly, and customers feel valued. Leave them hanging, and they're already frustrated when you finally connect. That's why callback widgets work so well - they eliminate wait time entirely.
Track response times by hour and day to optimize staffing and make changes as necessary. Customers don't care about your internal processes - they just want to know someone's listening.
Read also: How to Improve Lead Response Time & Why You Should (+Statistics)
9. Customer Churn Rate
Customer retention tells you who stays. Customer churn reveals who's leaving - and when measured properly, why they are leaving. This metric measures the percentage of customers who stop doing business with you over a specific period.
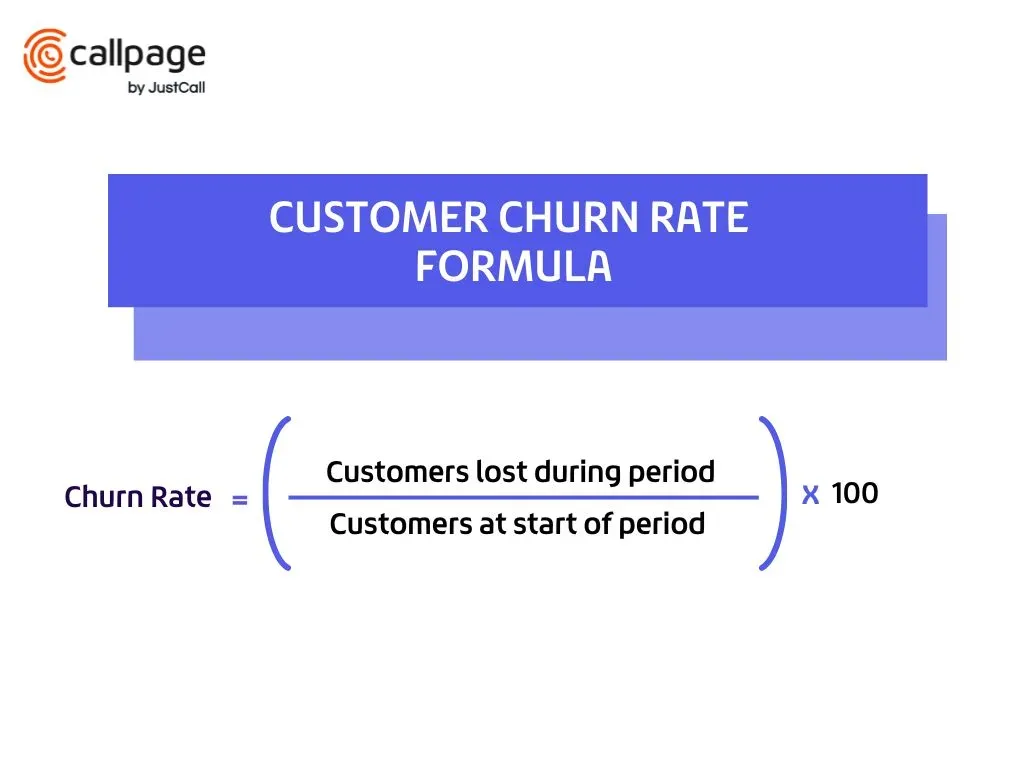
How to Calculate Customer Churn Rate?
Customer Churn Rate =(Customers lost during period ÷ Customers at start of period) × 100
Example: Start = 1,000, Lost = 75
Churn Rate = (75 ÷ 1000) × 100 = 7.5%
A 10% monthly churn means you're losing one in ten customers every month - leaky buckets that will sink your business growth, no matter how many new customers you attract.
Reduce churn by identifying at-risk customers before they leave. Look for warning signs through your other customer service metrics: decreased usage, unresolved support tickets, or low satisfaction scores. Proactive outreach to these customers can save relationships!
10. Agent Performance Metrics
Individual customer service agent metrics reveal who on your team is excelling in their role, and who may need extra support. Agent metrics include things like tickets resolved, customer feedback scores, and average handle time by agent.
How to Calculate Agent Performance?
Agent Performance are tracked individually and may include:
- Tickets resolved: Count per agent
- CSAT per agent: See CSAT formula
- Average handle time: Total talk + work time ÷ Number of tickets handled
- First contact resolution per agent: Tickets resolved on first try ÷ Total tickets per agent × 100
Pro tip: Always consider the complexity of cases and support seniority when comparing agent metrics.But when you measure agent performance, always remember: context matters.
Your top performer might handle fewer tickets because they tackle complex issues, while your brand-new agent may have slightly longer wait times while they are learning the ropes.
The best teams share winning techniques. When one agent consistently achieves high first contact resolution, find out their secret. Maybe they use specific phrases or have a unique troubleshooting approach. Spread these best practices to enhance customer satisfaction across your entire team.
How Can Technology Boost These Top Customer Service Metrics?
Part of the reason that many companies fail to track the best customer service metrics may be due to the traditionally manual ticket-counting methods. But those days are long behind us. Technology doesn't just track metrics - it changes how you interact with data and improves customer service performance.
- AI-powered analytics do the heavy lifting of pattern recognition. Instead of spending hours crunching numbers, AI identifies trends instantly.
- Real-time dashboards put critical metrics at your fingertips. The best dashboards take data and tell stories about what's happening and why.
- Integration allows your metrics system to talk to your CRM, calendar, and communication tools, and every other system you have. For instance, CallPage's system automatically tracks every interaction across channels - widget callbacks, AI Voice Agent conversations, scheduled meetings, and support calls.
AI and automation transform how teams measure and act on data. With real-time insights, tech-enabled service teams can prevent issues before they escalate.
CallPage Equips Teams in Measuring Customer Service Metrics for Business Success
CallPage really shines when it comes to measuring customer service. Every callback through the widget is instantly logged with timing data. The AI Voice Agent captures conversation details and qualification scores. Meeting scheduling tracks no-shows and satisfaction. You get a complete picture of customer interactions without lifting a finger.
Predictive analytics takes you from reactive to proactive. Instead of waiting for problems, you prevent them. Technology identifies which issues will likely escalate, which customers need attention, and which processes need fixing. It's like having a crystal ball for customer service success.
But metrics without action are just expensive decorations. Building a metrics-driven culture means empowering your customer service team with tools that make measurement easier. When tracking happens automatically, teams focus on what matters: helping customers and improving processes.
Better Customer Service Is Waiting. Are You Ready to Upgrade?
Are you ready to take the first step in upgrading your customer service? CallPage makes it simple. Our AI Voice Agent answers every call in 3 seconds, capturing crucial data while qualifying leads.
Start your 14-day free trial today and discover how the right technology turns customer service data into business success. When you measure what matters, improvement becomes inevitable. CallPage helps you do it better.
Start generating leads today!
Start a 14-day free trial now,
set up the widget on your site, and see how many more leads you can capture with CallPage
- No credit card required
- 10 minutes set up
- 14 days fully-features free trial